OlmoEarth v1.3 Launches With Browser-Based Satellite Map Analysis, No Login Required
Satellite analysis data covering land worldwide and adjacent coastal waters can now be explored in a browser, from finding similar places to comparing changes across years and making simple maps.
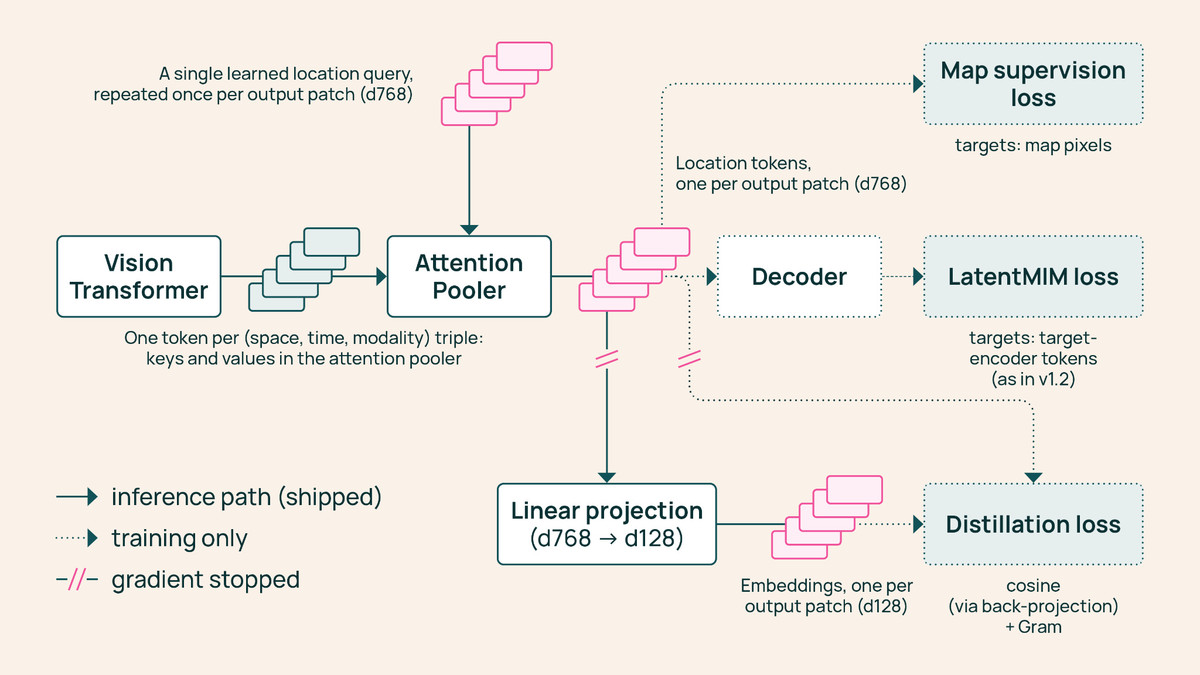
The OlmoEarth team released OlmoEarth v1.3, a satellite data analysis model, on October 22 local time. Alongside it came a set of precomputed global analysis data and a web tool called OlmoEarth Embeddings Explorer. According to the team, you can examine how a region has changed and search for similar places without logging in or installing anything.
Turning satellite imagery into numbers
At the heart of the release are “embeddings,” compressed numerical representations of what satellites observe. They capture the characteristics of a piece of land as numbers that can be reused across many kinds of analysis. The model reads a year’s worth of observations collected by Sentinel-1, Sentinel-2, and Landsat. It then divides the Earth’s surface into 10m by 10m cells and describes each cell with 128 numbers. A lighter version that uses only the first 64 is also available.
Until now, the main approach in OlmoEarth Studio was to fine-tune the model for each task and then apply it to satellite imagery. That process required a high-performance graphics card (GPU) and storage space for downloading imagery. This time, the precomputed data lets you train only a small classifier to produce crop maps or land cover maps showing what covers the ground. The team explained that the same data can be reused cheaply across many tasks.
What you can do in the browser
In Explorer, you can pan around the map to pick a region of interest and switch years to compare how the landscape has changed. The underlying Sentinel-2 imagery can be viewed alongside it. There are also features for clicking one location to find similar places, or labeling a handful of points to train a classifier. Results can be exported as GeoTIFF, a standard map file format.
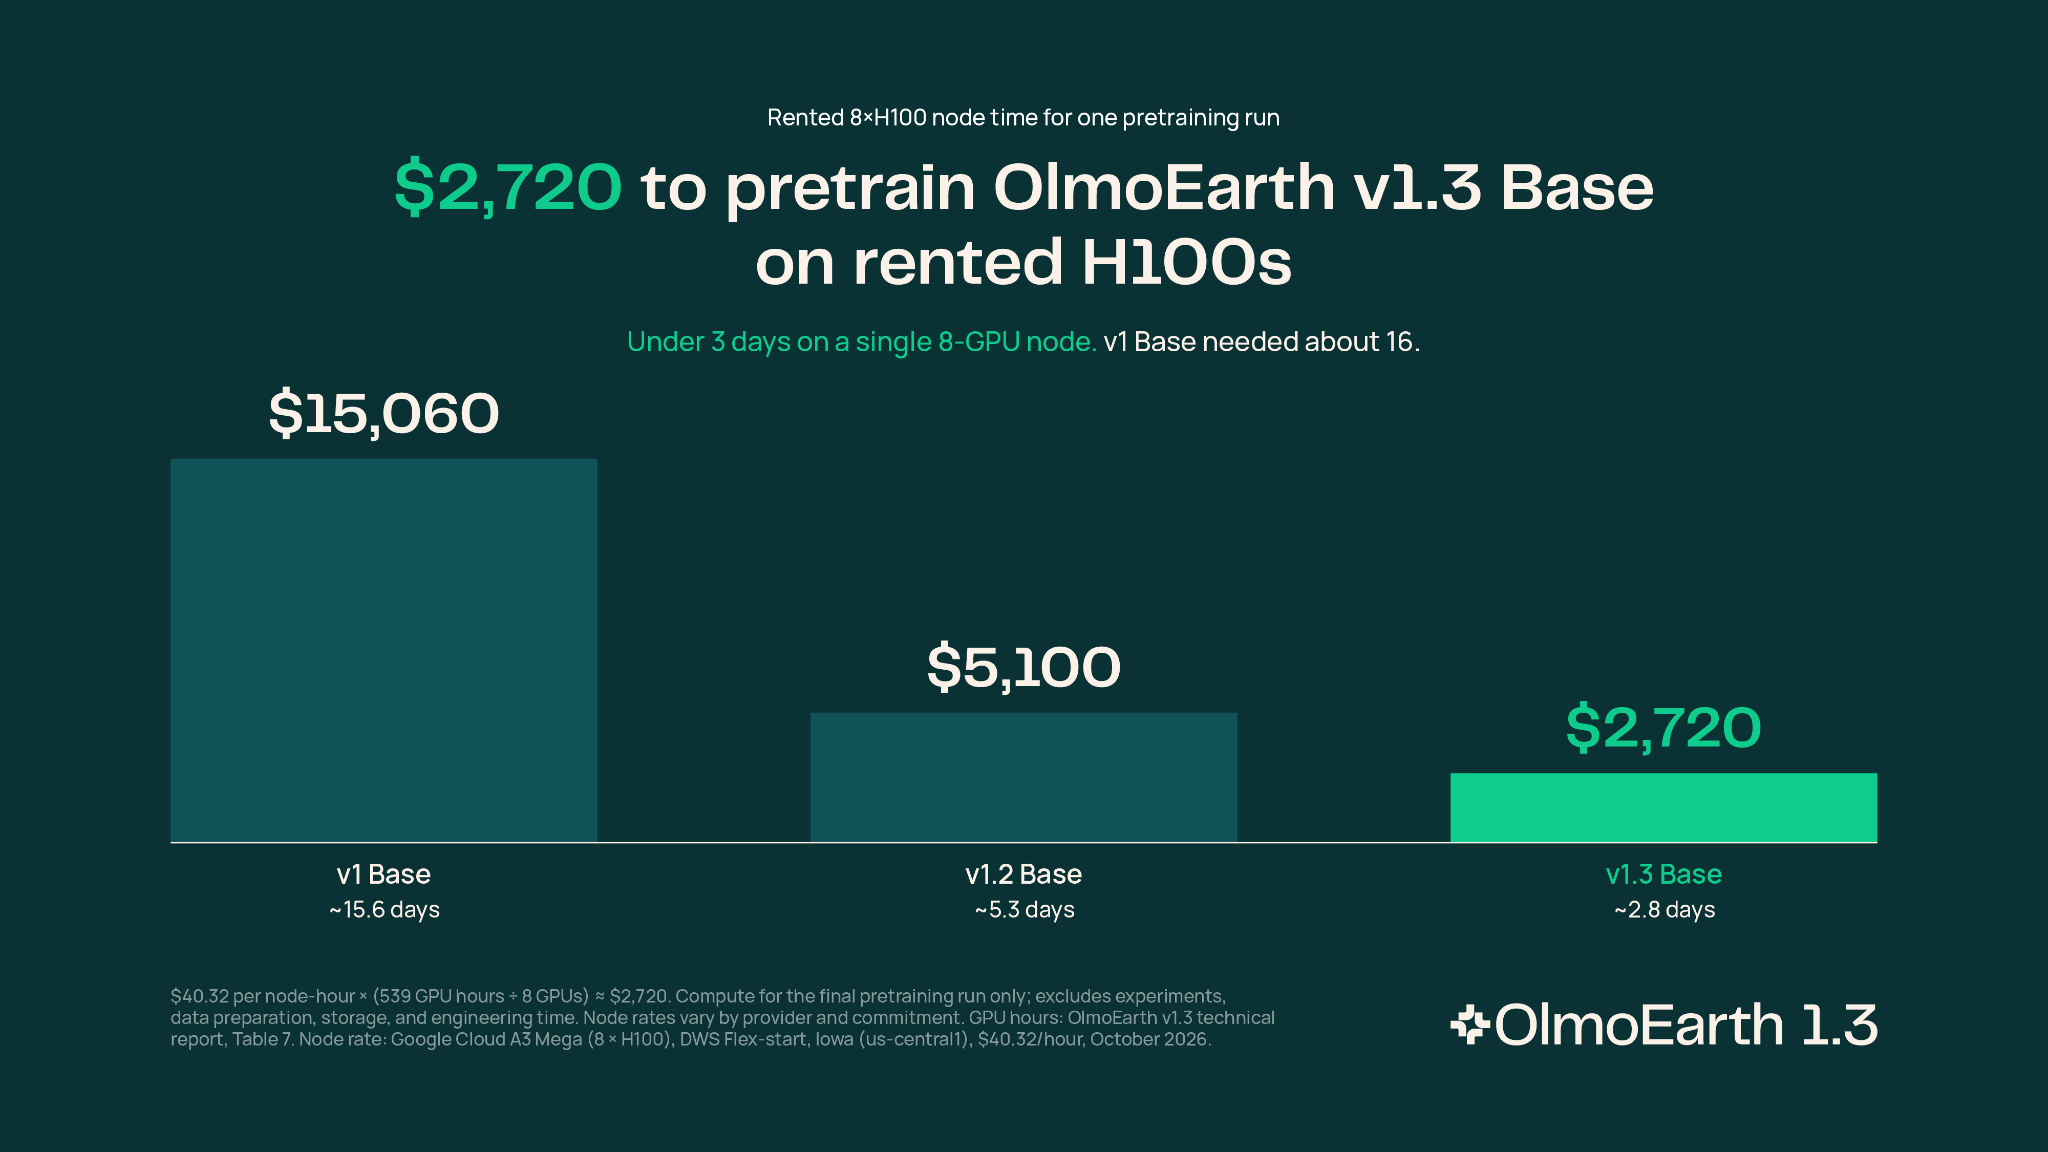
Image: huggingface.co
The team said Explorer lets you test an idea within seconds. Fine-tuning the model takes several hours. The pitch is that you can analyze a wide area with just a few labels and no high-performance graphics card. Example use cases they offered include distinguishing crops on smallholder farms in Kenya, detecting brick kilns west of Dhaka, and assessing fire damage in Indonesia.
For comparisons of change across years, they pointed to gold mining areas in the Peruvian Amazon. The team compared the numbers for 2017 and 2020, then those for 2020 and 2025, showing how the areas of concentrated change shifted over time. This kind of comparison requires no separate model training.
How it compares to other models
The team said it benchmarked the model against AlphaEarth Foundations and Tessera v2 across 27 performance tests spanning six continents. The version using 128 numbers scored highest on 20 of the tests, and the 64-number version on 18. They also introduced PLANTEUR, a new benchmark for distinguishing crop types in tropical regions.
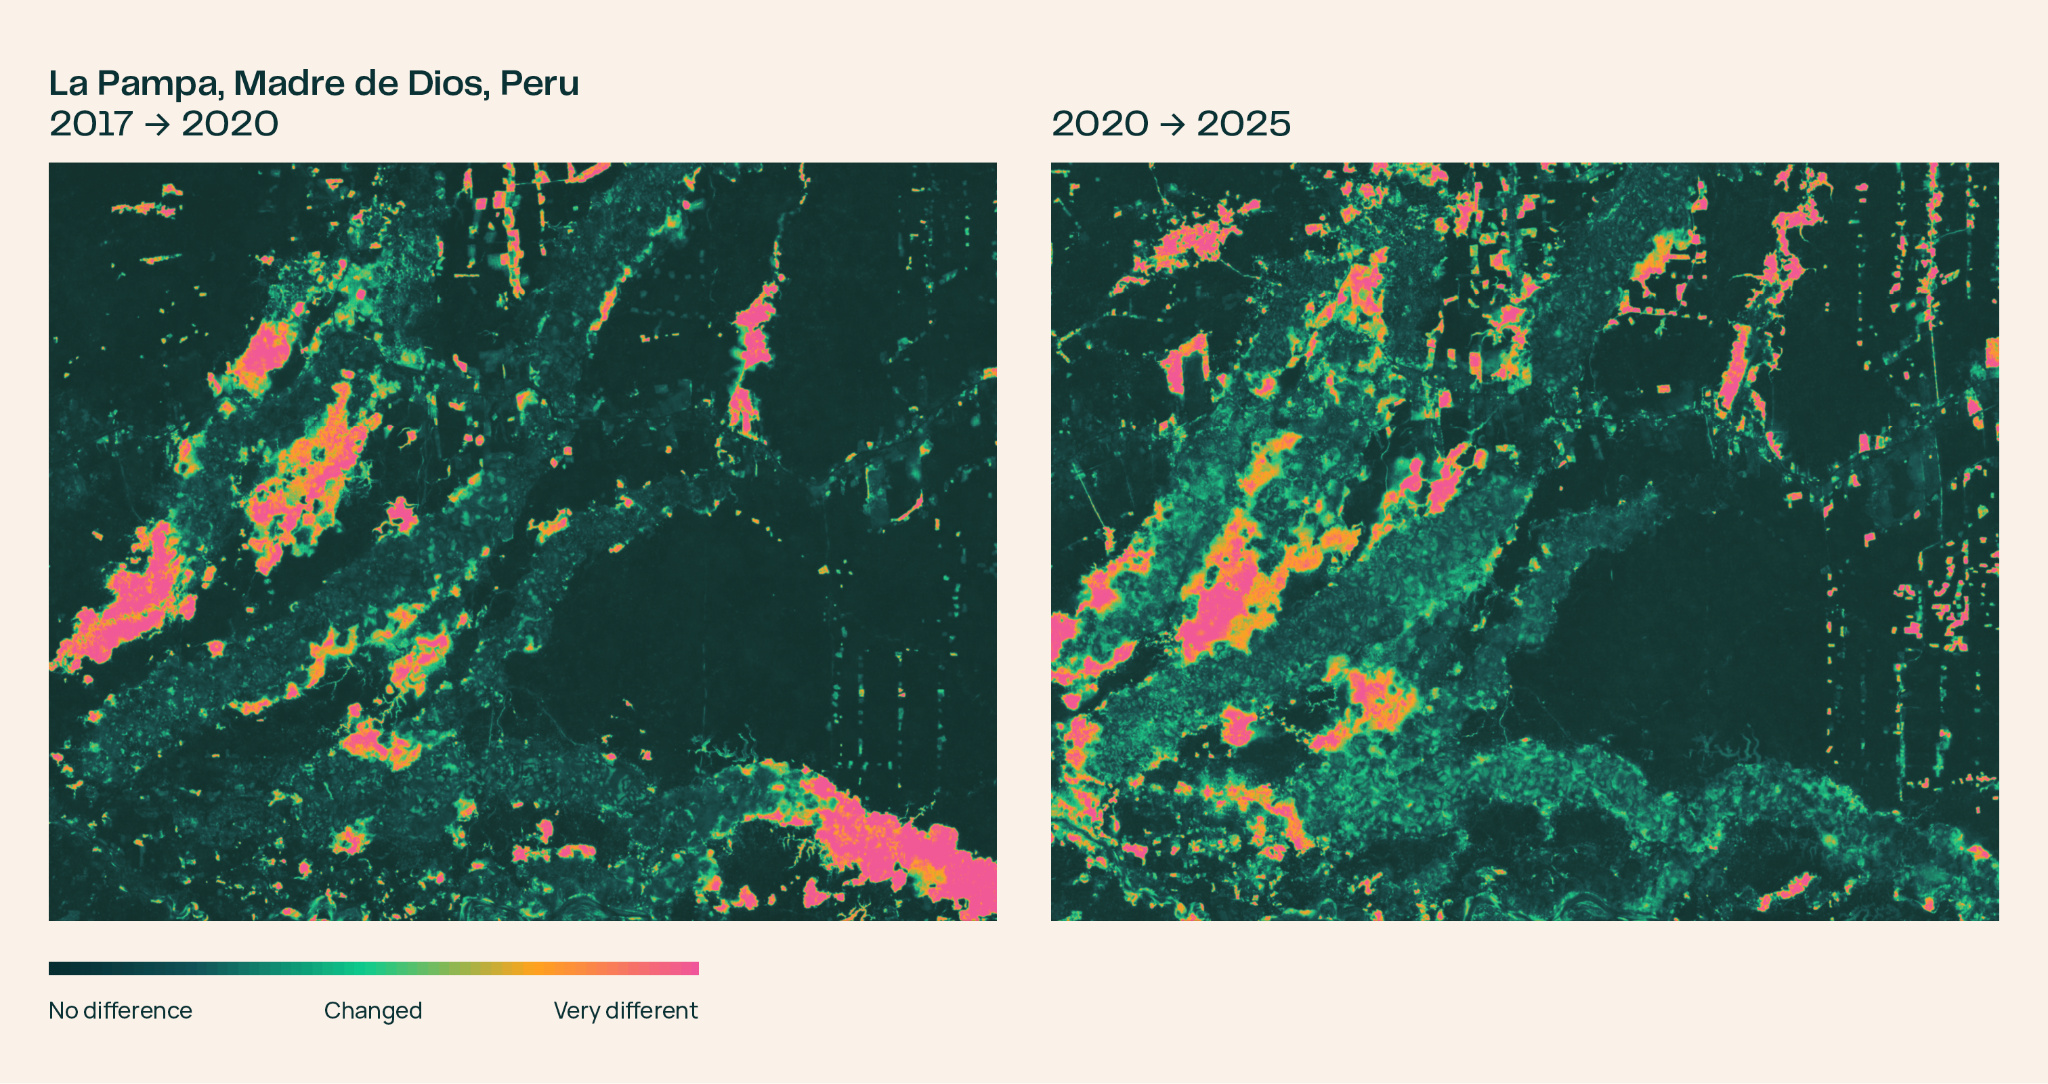
Image: huggingface.co
Compute time used for training came to 53% of v1.2 and 18% of v1, according to the team. They estimate that reproducing the pretraining of OlmoEarth v1.3 Base as-is would cost roughly $2,720 in rental fees for H100 high-performance AI chips for the final run. The model, training data, and training code have been released publicly, with the OlmoEarth Artifact License applied to the distributed artifacts.
As of release, the data covers land worldwide and adjacent coastal waters for 2023 to 2025. The 2017 to 2022 period includes only some countries, and the team said it plans to expand coverage. You can look at the data for your region of interest in the browser first, then decide whether to fine-tune. The upshot is that this release lowers the barrier to getting started with satellite analysis.