Google DeepMind Maps Where Forests Have Become Farmland
ForTy 2020 divides the world's land into 10m by 10m cells and sorts them into six categories spanning forest, plantation, and other land. A companion dataset shows how forests changed each year from 2017 to 2025.
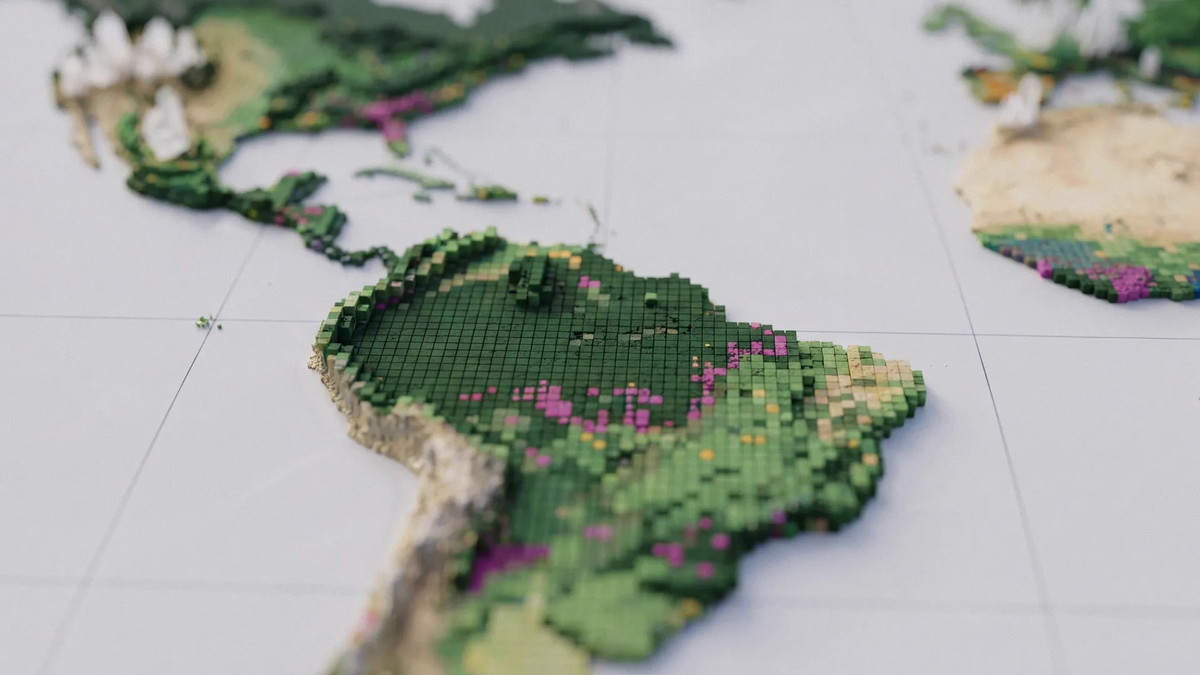
Google DeepMind and Google Research released “Forest Typology (ForTy) 2020” on October 22 local time, a map that distinguishes the different types of forest around the world. It was built together with the World Resources Institute (WRI) and the International Institute for Applied Systems Analysis (IIASA). The map divides the planet’s land surface into 10m by 10m cells and labels each one as one of six categories, including forests and tree-crop farms.
An accompanying annual dataset, released as an early preview, shows how forests changed year by year from 2017 through 2025. It makes it possible to locate places where natural forest has disappeared, and to see whether that land was converted into timber plantations, agricultural plantations, or some other use. The focus is less on how much tree cover was lost than on tracking what the forest was turned into.
Is all land with trees on it the same forest?
Patches of land that look like similar shades of green in a satellite image can have very different ecological value. Google DeepMind explained that an old-growth tropical rainforest, a eucalyptus plantation, and an oil palm plantation store different amounts of carbon and support different species. Primary forest that has never been cleared, the company said, holds far more carbon and far more biodiversity than a single-species plantation that is cut every 10 to 20 years.
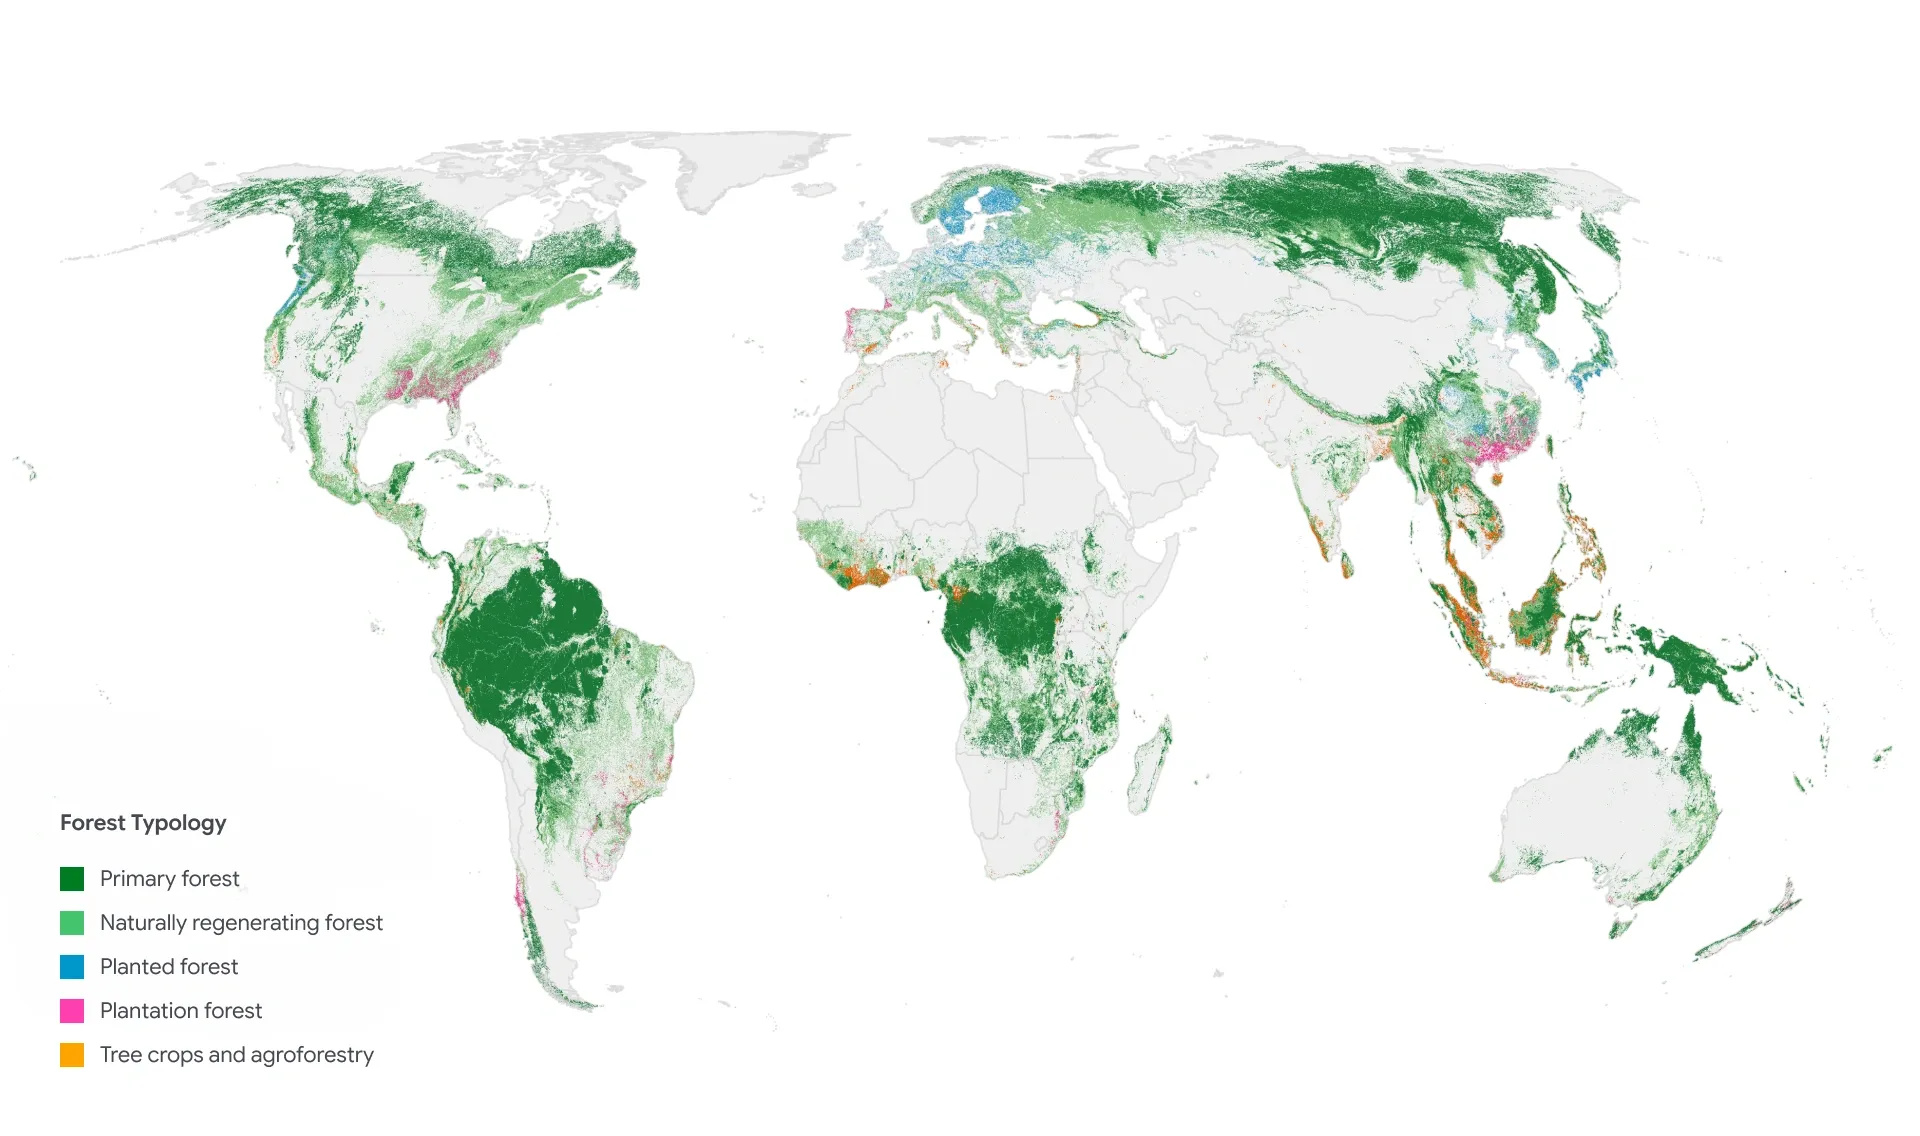
Image: Google DeepMind
What sets this apart from earlier maps is how finely it slices up the category of “forest.” “Natural Forests of the World 2020,” which the researchers released last year, was also a 10m-resolution map, but it concentrated on sorting land into natural forest and not natural forest as of 2020. ForTy shows what kind of forest or plantation sits on a given piece of land. Read alongside the annual data, it also reveals how that classification shifted from year to year.
The classification scheme follows definitions from the UN Food and Agriculture Organization (FAO). Forests are split into four types: primary forest with no visible sign of human intervention, forest that has regrown on its own after logging or fire, and forest that people planted or seeded and manage on long rotations. The fourth is intensively managed plantations of fast-growing trees.
The remaining two categories are plantations of tree crops and agroforestry, and other land. Plantations that yield non-timber products such as oil palm, rubber, cocoa, and fruit are classified separately from forest. Grassland, cropland, cities, and water are all grouped under other land. Even where the trees are still standing, land that has shifted from natural forest to crop plantation is marked as a different category.
Sorting out where your coffee and furniture came from
The main application the researchers point to is compliance with the European Union Deforestation Regulation (EUDR). Google DeepMind explained that companies and regulators need to know whether the raw materials in products such as coffee, cocoa, and palm oil came from land that was forest in 2020 and was later converted to farmland. For timber products such as furniture, there is one additional test. Products are not permitted, the company added, if they come from land where primary forest was converted into planted forest or intensively managed plantation forest, or where naturally regenerated forest was converted into intensively managed plantation forest.
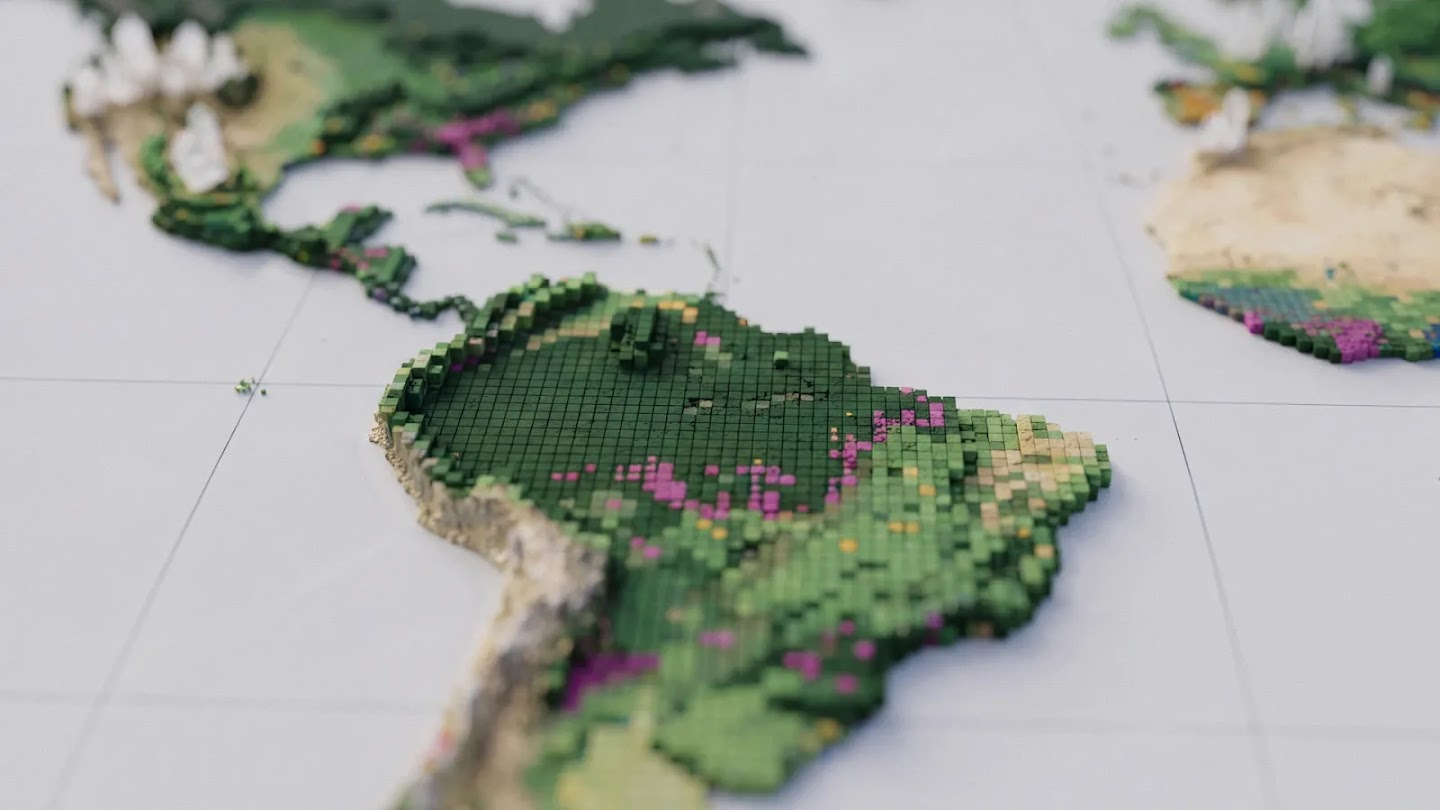
Image: Google DeepMind
The researchers present the map as a baseline for assessing the results of forest conservation and for watching the conversion of natural forest into plantations. How useful it proves will depend on how accurately the six types can be told apart on the ground, and on how faithfully the 2017 to 2025 data reflects actual changes in land use.