Google Puts Its Place-Based AI to Work on Dengue Forecasts and Vaccination Estimates
Google has published five collaborative studies applying PDFM, a model that summarizes the characteristics of a place as numbers, to public health. The approach adds place-level data to existing health prediction models to help estimate vaccination rates and forecast infectious disease.
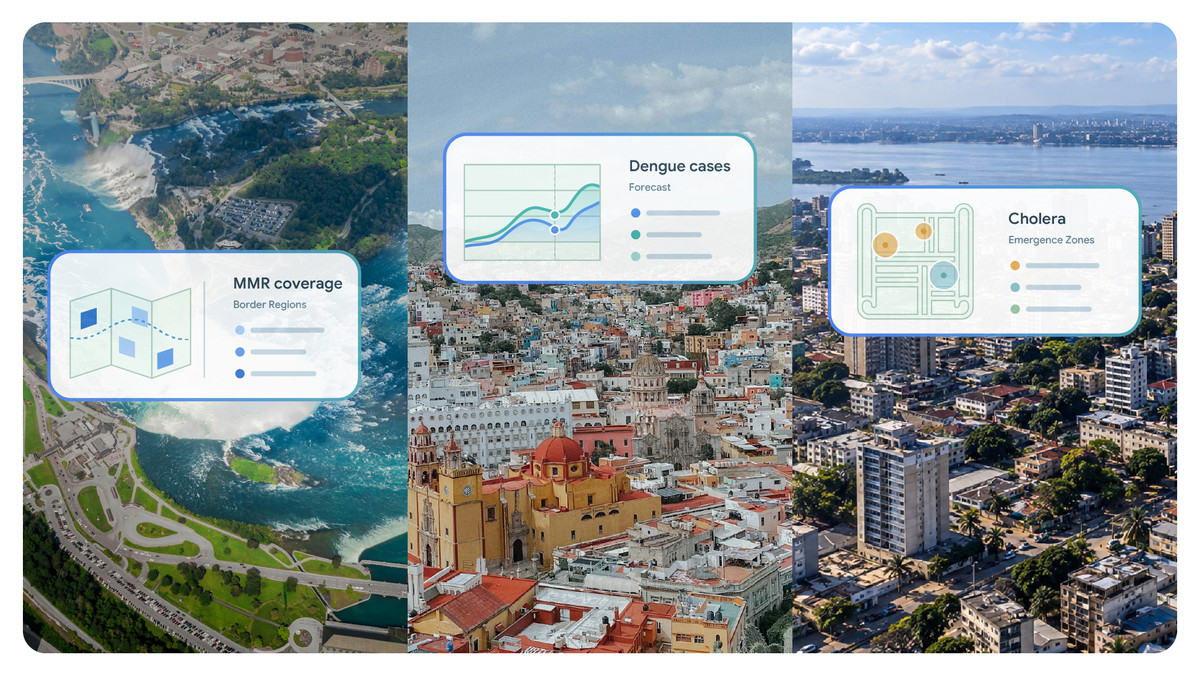
On October 6, Google published five collaborative studies that apply PDFM, part of Earth AI, to public health. PDFM is a model that distills the characteristics of a place into a set of numbers. The studies range from estimating vaccination rates and cardiovascular disease deaths in the United States to forecasting dengue in Mexico and cholera in the Democratic Republic of the Congo. Google says the place-level information can simply be layered on top of existing health prediction models.
Why add place-level data?
To decide where to send staff and supplies, health authorities need timely information about conditions in each area. Google points out that existing health statistics can arrive years late, stop at national borders, or be scarce in some regions. Collecting and cleaning a separate dataset for every disease also slows down rapid response, the company says.
PDFM compresses search trends, human mobility patterns, how densely buildings are packed, and environmental factors into numbers that represent the features of each area. According to Google, it uses signals processed so that individuals cannot be identified, and the place-level data is refreshed every month. Instead of gathering raw data themselves, researchers only need to drop this information into their existing analyses. Google says that across several studies, results matched or beat those from the original input data without any additional disease-specific training of the model.
Is data from across the border useful?
Along the US-Canada border, estimates of vaccination rates improved when data from both countries was used together. Researchers at Mount Sinai Health System and Boston Children’s Hospital examined 146 US counties within 150 km of the border. Adding Canadian place-level data raised the share of county-to-county variation in measles, mumps and rubella (MMR) vaccination rates that the model could explain from 16% to 22%. Google attributes the gain to the influence of cross-border movement and behavior being captured in the data.
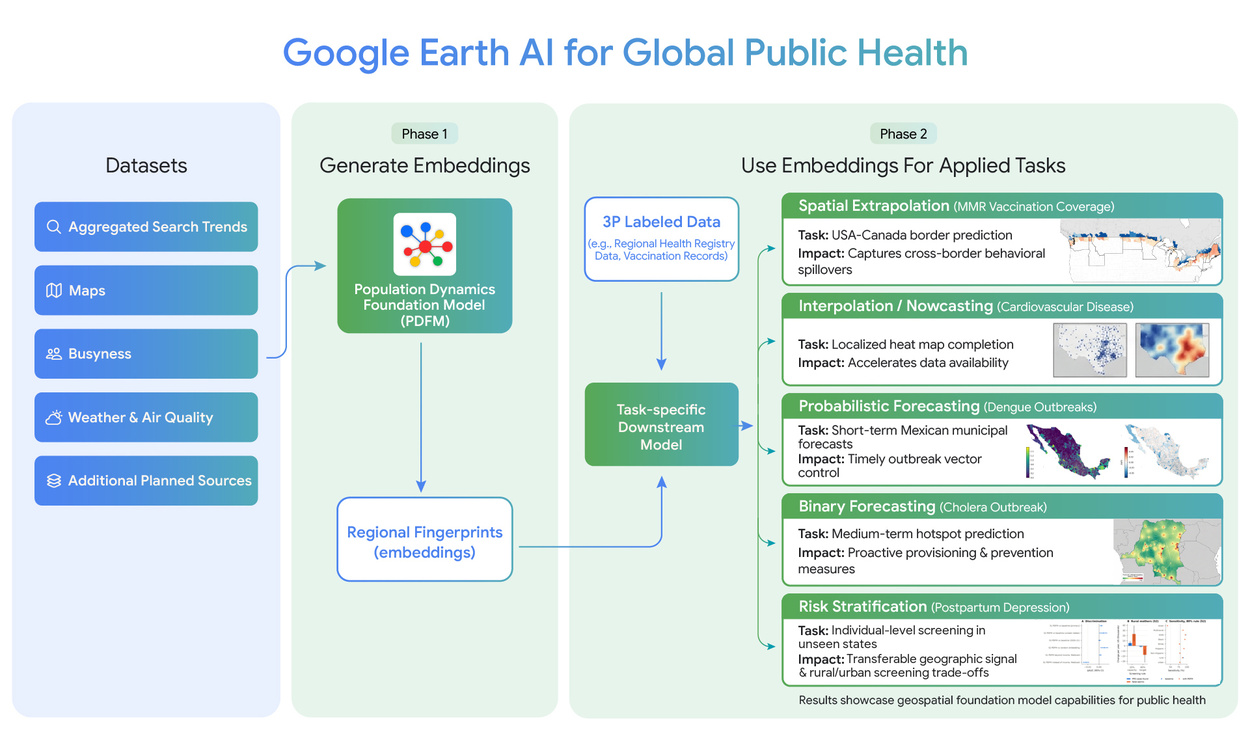
Image: research.google
The studies also looked at whether the approach can fill the gap left by lagging statistics. Researchers at NYU Grossman School of Medicine estimated current-year cardiovascular disease deaths across roughly 3,100 US counties. There was no clear difference between results using PDFM and results using conventional census data. Google emphasizes that while census figures can reflect conditions from as long as two to three years earlier, PDFM can draw on more recent place-level information.
How much better are the dengue forecasts?
The Mexico study forecast dengue cases from 2020 to 2025 across about 2,450 municipalities. The researchers combined PDFM with TimesFM 2.0, a model that forecasts change over time. According to Google, the biggest gains came at a one-month horizon, with accuracy improving in up to 72% of areas with active transmission. In the DRC cholera study, one- to two-week forecasts did not improve noticeably. Google says the approach did help with four- to eight-week forecasts, the window in which supply movements can be arranged in advance.
Image: research.google
A study on postpartum depression examined how place-level data affects the choice of who receives follow-up support. Researchers at the University of Washington evaluated PDFM using data from 332,970 participants in a US Centers for Disease Control and Prevention survey. In a simulation that assumed follow-up support for the highest-risk 20% of mothers, adding place-level data was estimated to reach an additional 5,640 rural mothers experiencing postpartum depression each year.
PDFM’s place-level data is available for paid preview through Population Dynamics Insights on the Google Maps Platform. Academic and public health researchers can apply for free access, limited to research rather than running live services. The significance of this round of work is that place-level data was layered onto existing health analyses and used to decide where prevention efforts and support should go. Google names two next challenges: reflecting how places change over time, and extending the approach to regions with limited internet connectivity.